Research Article - Journal of Environmental and Occupational Health (2022)
Correlation of Chromium (VI) Concentration in Workers Breathing Zones and Total Chromium in Urine Samples of Electroplating Workers
Majid Shahi1*, Ali Asghar Farshad1, Shahnaz Bakand2 and Fereshteh Eshaghzadeh32Department of Health & Society, University of Wollongong, Wollongong, Australia
3Department of Health, Tarbiat Modares University, Tehran, Iran
Majid Shahi, Department of Occupational Health, Iran University of Medical Sciences, Tehran, Iran, Email: majidshahyhse@gmail.com
Received: 02-Mar-2022, Manuscript No. JENVOH-22-55936; Editor assigned: 04-Mar-2022, Pre QC No. JENVOH-22-55936 (PQ); Reviewed: 21-Mar-2022, QC No. JENVOH-22-55936; Revised: 28-Mar-2022, Manuscript No. JENVOH-22-55936 (R); Published: 05-Apr-2022
Abstract
The aim of this research was to investigate the correlation between chromium (VI) concentration in the breathing zone of workers and total chromium in urine specimens as a biomarker of exposure in chromium electroplating workers. In chromium plating, different airborne concentrations of chromium (VI) can be released into the breathing zone of workers. For measurement of chromium (VI) concentration 69 air samples were collected by filtration technique and collected samples were analyzed using NIOSH method 7600. Air sampling from breathing zones was conducted by personal sampling method and further personal exposures to chromium VI was calculated as Time-Weighted Average (TWA) values. For biological monitoring total chromium in urine was measured using WHO method, also this method has been recommended by ATSDR. For this purpose 92 urine samples were collected and analyzed by atomic absorption method equipped with graphite furnace. Data analysis was performed using SPSS version 18 software. The average of chromium VI in worker’s breathing zones was obtained (16.90 ± 23.11 μg/m3). The average of increasing chromium concentration in end of workweek urine samples (8.67 ± 3.97 μg/L) was significantly higher than the average of end of shift samples (4.11 ± 2.57 μg/L). After regression analysis statistically significant correlation was obtained between airborne chromium VI in worker’s breathing zones and chromium in urine samples (e.g. R2=0.83, end of shift samples). The obtained results indicated that the determination of urine chromium content can be considered as an appropriate biomarker for biological monitoring of workers particularly for recent chromium exposure assessment.
Keywords
Biological monitoring; Biomarker; Breathing zone; Chromium electroplating; Chromium VI; Urine sample
Introduction
Chromium (Cr) is a heavy metal usually found at the workplace environment and industrial wastewater of metal processing sites, plating industries, painting industries, textile, leather tanneries, and many more [1]. Chromium is widely used in metal plating or electroplating to create a metal surface that is hard and beautiful and prevent corrosion [2]. Occupational exposures to soluble hexavalent chromium (Cr6+) has been known to cause ulceration and perforation of the nasal septum, bronchitis, asthma, liver and kidney damage and dermatitis in exposed workers[3]. The International Agency for Research on Cancer (IARC) has classified chromium (VI) compounds as carcinogen to human. Chromium (Cr) on the metal plating has the potency to contaminate the working environment and endanger the health of workers due to exposure to Cr (VI), which is primarily through of inhalation can cause effect such as impairment of respiratory, liver, kidney, and cancer. Inhaled chromium will go into the lungs and the bloodstream or absorbed through the blood, transported to the kidneys, and eventually excreted through the urine [4].
Concerning the irritant effects and the potential carcinogenicity of chromium (VI), the American Conference of Governmental Industrial Hygienists (ACGIH) has suggested a (TLV-TWA) of 0.2 μg/m3 for inhalation exposure to soluble Cr6+ compounds. The 8-h exposure limit to Cr (VI) according to OSHA and NIOSH are 5 and 0.2 μg/m3, respectively. Biomarkers indicate the presence of chemical elements affecting the biological mechanisms of living systems. Biomarkers are the observable indicators in a chain of events caused by exposure to environmental factors [5,6]. They can also be used to evaluate the intensity and duration of exposure, the effectiveness of control measures and the symptoms at early stage of diseases.
Chromium in blood and urine has been used as a biomarker of environmental exposure. Exposure to chromium can increase chromium concentration in the blood (whole blood, serum, and erythrocytes), urine, hair, and nails. Increased chromium in blood and urine is considered an indicator of the most reliable exposure. Results concluded from many researches show that exposures to chromium increase its concentration in blood, urine, plasma, hair and nails [7,8]. The ACGIH has also suggested two other Biological Exposure Indices (BEIs) for worker’s urinary chromium concentration measured at the end of the shift on the last day of the work week and the increase in the urinary chromium concentration during one day shift. In this research, the American Conference of Governmental Industrial Hygienists (ACGIH), Biological Exposure Indices (BEIs) have been taken into account, which are (10 μg/g Creatinine) for urinary chromium concentration during a single work shift and (25 μg/g Creatinine) at the end of the last day of a work week [9].
The purpose of the present research is to study the correlation between the concentration of hexavalent chromium in the breathing zone of workers in the chromium plating industry and its biomarker in their urine samples. In this research two types of chromium plating have been studied including decorative chromium plating (also known as nickel-chromium plating) and industrial chromium plating (hard chromium). In chromium plating, the desired thickness of chromium on objects varies depending on the type of plating; therefore different airborne concentrations of chromium are released into the breathing zone of workers [10].
Materials and Methods
Sample selection
The present research is a cross-sectional study and has been conducted in decorative and hard chromium plating industries. In this study, in order to analyze the correlation between workers’ breathing zone concentration of hexavalent chromium and its biomarker in urine, 23 workers were chosen from two nickel-chromium plating industries as well as one hard chromium plating industry. All workers except those suffering from renal diseases were examined. None of participants in this research were using any respiratory protective equipment during plating. Participants were included: nickel-chromium plating workers (n=6), hard chromium plating workers (n=4), polishers (n=5) and template molding workers (n=8).
Chromium monitoring In the breathing zone
In this study, in order to measure airborne chromium (VI) in the breathing zone, 69 air samples were collected through personal sampling and samples were analyzed using NIOSH 7600 method. To measure occupational exposure to chromium (VI), three samples were collected from the breathing zone of each worker in different hours of a single working day including morning, noon and afternoon [11]. After analyzing the samples, the results were calculated as the Time Weighted Average (TWA) for each worker. To collect breathing zone samples in accordance with NIOSH 7600, a 5 μm pore size PVC sampling filter was used as the collecting medium. Collected samples were analyzed using a visible spectrophotometer at a wavelength of 540 nm following the formation of chromium (VI) - diphenylcarbazide complex and results were calculated as chromium concentration in terms of μg/m3 of the air.
Biological monitoring of chromium in urine
Chromium level in urine is a measure of exposure to total chromium as Cr (VI), reduced to Cr (III) in the body. Hence they measured the level of urinary chromium in plating workers and concluded that there was a significant increase in the level of this element in urine [12]. For biological monitoring, the total concentration of chromium in urine was determined as the selected biomarker. Measuring the total urinary chromium was done as suggested by WHO and 92 urine samples were collected and analyzed by Atomic Absorption Spectroscopy equipped with a Graphite Furnace (AAS-GF) [13]. Biological samples were collected in different times and 4 samples were taken from each worker according to a specific schedule. The first sample was taken in the morning of the first day of work week prior to start the work, the second at the first day of work after 4 hours of exposure, the third sample at the end of the first day of work and the fourth sample at the end of shift in the last day of the workweek. Urine samples were collected in 50 ml polypropylene containers and were stored at the temperature of -18°C before being analyzed. The collected biological samples were analyzed as suggested by WHO and using the AAS-GF method.
During the analysis, urine samples were diluted by Nitric acid 2% (HNO3) and Triton x-100 (0/001%) and the absorption level was measured. The detection limit was equal to 0.5 μg/L. In order to determine the urinary chromium concentration, a mixture of the sample and modifier were injected directly into the graphite tube and atomization was performed through electrical heating at multiple stages. In this method, interference by biological matrix was eliminated to a large extent by using background correction (Zeeman Effect or Quartz halogen lamp). Programs, specifications and conditions of atomic absorption spectrometer for analyzing samples are shown in Table 1. In order to adjust the urine excretion fluctuations, urinary creatinine concentration was determined using JAFFE method. The Jaffe reaction is a colorimetric method used in clinical chemistry to determine creatinine levels in blood and urine and obtained chromium concentration was calibrated according to urinary creatinine. This adjustment was due to differences in liquid consumption by each individual and consequently different volumes of urine and sample concentration [14-17].
| Analytical step | Step duration Ramp time (s) |
Hold time (s) |
Temperature °C |
|---|---|---|---|
| Drying | 10 | 25 | 110 |
| Charring I | 20 | 20 | 1200 |
| Charring II | 1 | 2 | 1200 Gaps stop |
| Atomization | 0 | 4 | 2300 Gaps stop |
| Heating | 1 | 7 | 2650 |
| Cooling | 1 | 9 | 20 |
Model statistical analysis
Statistical analysis of obtained results was performed using SPSS version 18. Data correlation was studied through regression analysis and Pearson correlation.
Results
In this study, results from monitoring of the average chromium concentration in the breathing zone and concentration levels of urinary chromium biomarker were taken and the correlation between chromium (VI) concentrations in the breathing zone and its urinary biomarker levels was analyzed.
Breathing zone Chromium VI concentrations
The average and standard deviation of chromium (VI) concentration in nickel-chromium and hard chromium industries separately and chromium industry in general are shown in Table 2. As shown in Table 2, the average chromium (VI) concentration in the breathing zone is 11.23 ± 9.16 μg/m3 which is 7.25 ± 3.80 and 17.43 ± 11.67 for nickel-chromium and hard chromium industries respectively. Results showed that there is a statistically significant difference in occupational exposure to chromium (VI) between nickel-chromium and hard-chromium plating workers (p<0.001).
| Variant name | Chromium industry | Hard chromium industry | Nickel-chromium industry | p-value | |||
|---|---|---|---|---|---|---|---|
| Chromium (VI) concentration in breathing zone µg/m3 | A | SD | A | SD | A | SD |
P<0.001 |
| 11.23 | 9.16 | 17.43 | 11.67 | 7.25 | 3.8 | ||
Urinary chromium concentrations
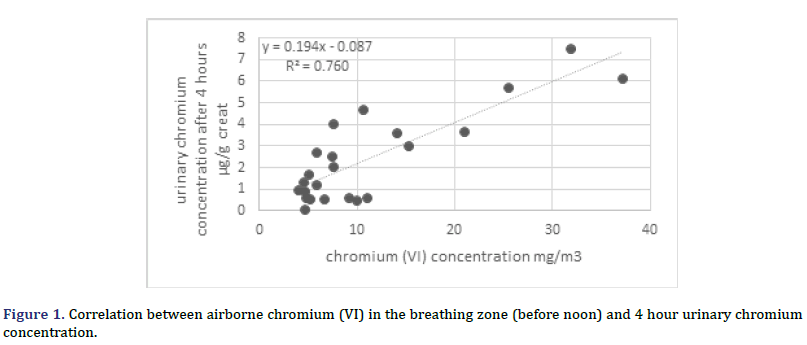
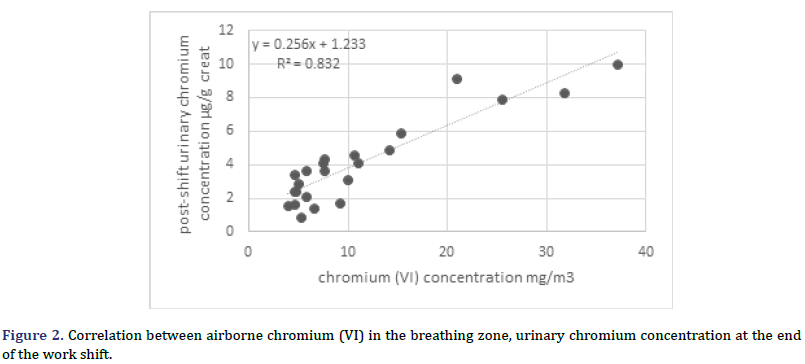
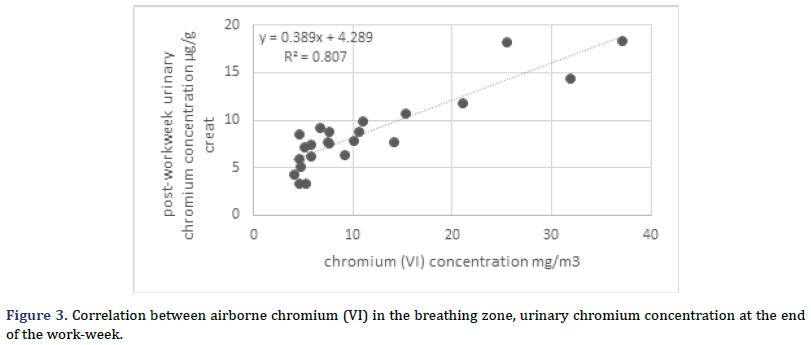
The average and standard deviation of total urinary chromium concentrations of workers in nickel-chromium and hard chromium industries are shown in Table 3. Comparing results by the process type, shows that there is a significant difference between urinary chromium concentrations of workers from nickel-chromium and hard chromium industries (p<0.001). Time-dependent increase rate of urinary chromium concentration in chromium plating workers is shown in Table 4. Figure 1 shows the correlation between airborne chromium (VI) concentration and the total urinary chromium concentration after 4 hours of exposure. In this study, regression analysis showed that there is a significant correlation between airborne chromium (VI) in the breathing zone and the 4 hours urinary chromium concentration (R2=0.760; p<0.001). Figure 2, regression analysis showed that there is a significant correlation between airborne chromium (VI) in the breathing zone and the urinary chromium at the end of work shift (R2=0.832; p<0.001). Figure 3, regression analysis showed that there is a significant correlation between airborne chromium (VI) in the breathing zone and the urinary chromium concentration at the end of the work-week (R2=0.807; p<0.001).
| Variant name | Chromium industry | Hard chromium industry | Nickel-chromium industry | p-value | |||
|---|---|---|---|---|---|---|---|
| M µg/g Creatinine | SD | M µg/g Creatinine | SD | M µg/g Creatinine | SD | ||
| Pre-shift urinary chromium concentration | 2.976 | 1.658 | 4.13 | 1.718 | 2.234 | 1.149 | p<0.001 |
| 4 hour urinary chromium concentration | 5.391 | 3.582 | 7.784 | 4.037 | 3.853 | 2.273 | p<0.001 |
| Post-shift urinary chromium concentration | 6.905 | 3.931 | 9.593 | 4.418 | 5.176 | 2.433 | p<0.001 |
| urinary chromium concentration at the end of the week | 11.641 | 5.468 | 15.371 | 6.344 | 9.243 | 3.163 | p<0.001 |
| Variant name | Chromium industry | Hard chromium | Nickel-chrome industry | p-value | |||
|---|---|---|---|---|---|---|---|
| M µg/g Creatinine | SD | M µg/g Creatinine | SD | M µg/g Creatinine | SD | ||
| Increase rate of urinary chromium concentration in 4 hours | 2.415 | 2.09 | 3.654 | 2.476 | 1.618 | 1.368 | P=0.02 |
| Increase rate of urinary chromium concentration in one work shift | 4.109 | 2.57 | 5.832 | 3.019 | 3.002 | 1.482 | p<0.001 |
| Increase rate of urinary chromium concentration in one work week | 8.665 | 3.972 | 11.241 | 4.692 | 7.009 | 2.366 | p<0.001 |
Discussion
After studying the correlation between hexavalent chromium concentration in the breathing zone of workers in chromium industries and consequently the urinary chromium concentration of these workers after the work shift, a positive and significant correlation between these two factors was seen to exist (R2=0.832; p<0.001). These results show that chromium concentration in the breathing zone is directly linked to post-shift urinary chromium concentration and an increase in the breathing zone chromium concentration brings about an increase in the urinary chromium concentration. Hence, the results of the present research confirm that the urinary chromium concentration can be used as a valuable biomarker to evaluate the occupational exposure to chromium (VI).
In the present research, no significant correlation was seen between work experience and post-shift urinary chromium concentration. Results show that stopping exposure to chromium (VI) brings about a reduction of urinary chromium concentration due to the daily urine excretion. Therefore, post-shift urinary chromium concentration could be considered as an indicator for short term or recent exposures to chromium (VI). Although post-shift sampling usually shows recent exposures to chromium, previous exposures may affect it to some extent. Comparing results obtained from chromium concentration increase after different periods of time is a confirmation to this fact and shows an increasing process during the workweek. On the other hand, Table 3 shows that at the first working shift and after avoiding exposure due to the weekend, urinary chromium concentration drops to the minimum level but is still above zero.
After studying the correlation between chromium (VI) concentration in plating workers’ breathing zone and the total urinary chromium concentration at the end of the workweek, a positive and significant correlation R2=0. 807; Y=0.389X+4.289 between these two factors was obtained (p<0.001). This result shows that chromium concentration in the breathing zone and urinary chromium concentration at the end of the work-week are directly linked to each other and an increase in the breathing zone chromium (VI) concentration leads to an increase in postshift urinary chromium concentration of the end of the work-week. These results show that urinary chromium concentration could be an appropriate indicator for monitoring occupational exposures to chromium (VI).
As shown in Table 2, the average chromium (VI) concentration in the breathing zone is 11.23 ± 9.16 μg/m3, 7.25 ± 3.80 in nickel-chromium, and 17.43 ± 11.67 in hard chromium industries. Comparing results regarding process types, showed that there is a significant difference between nickel-chromium and hard chromium industries concerning workers’ exposure (P<0.001). Therefore, it can be concluded that exposure rate in hard chromium industries is much higher than that in nickel-chromium industries. One main reason might be the different time periods required for plating each piece in these processes. In nickel-chromium industries, each piece takes about 15 to 20 seconds in the plating vat and a thin layer of chromium is formed on its surface and then is removed from the vat and another piece is placed into it. Between removing pieces from the vat and placing new ones, the vat is inactivated and therefore no chromic acid mist would be formed. But in hard chromium plating industries, because a thicker chromium layer is needed on each piece the plating time increases significantly which varies between several hours up to several days.
Conclusion
Comparison between the average chromium (VI) concentration 11.23 ± 9.16 μg/m3 in workers’ breathing zone and the ACGIH threshold limit value of dissolved hexavalent chromium (TLVTWA=0.0002 mg/m3) clearly shows that the exposure level of plating workers in this study is higher than the recommended threshold limit value.
Comparing the increase rate of post-shift (4.109 ± 2.57 μg/g creatinine) and end of the work-week (8.665 ± 3.97 μg/g creatinine) urinary concentrations of chromium VI with the recommended biological exposure indices (10 μg/g creatinine & 25 μg/g creatinine) have revealed similar results.
Although the concentrations of chromium in breathing air are way higher than the TLVTWA, the urinary chromium levels are still in BEI range. Results obtained from this study shows that regarding the reduction of Chromium TLVTWA over the past years, a review and revision of Chromium BEI is highly recommended.
Competing Interests
The authors declare that they have no competing interests.
References
- Levankumar L, Muthukumaran V, Gobinath MB. Batch adsorption and kinetics of chromium (VI) removal from aqueous solutions by Ocimum americanum L. seed pods. J Hazard Mater 2009; 161:709-713.
[Crossref] [Google scholar] [Pubmed]
- Ashley K, Howe AM, Demang M, Nygren O. Sampling and analysis consideration for the determination of hexavalent chromium in workplace air. J Environ Monit 2003; 5:707-716.
[Crossref] [Google scholar] [Pubmed]
- Khambhaty Y, Mody K, Basha S, Jha B. Kinetics, equilibrium and thermodynamic studies on biosorption of hexavalent chromium by dead fungal biomass of marine Aspergillus niger. Chem Eng 2009; 145:489-495.
- [4] Malene B.H, Stefan.R, Torkil.M, Jeanne D. Quantitative aspects of contact allergy to chromium and exposure to chrome-tanned leather. Contact Dermatitis 2002; 47:127–134.
[Crossref] [Google scholar] [Pubmed]
- Klaassen CD, Amdur MO,Doull J. Casarett and Doull's Toxicology Basic Science of Poisons, 9th edition. Mc Graw-Hill, New York 2018.
- Wijayawardena MAA, Megharaj M, Naidu R. Exposure, toxicity, health impacts, and bioavailability of heavy metal mixtures. Advances in agronomy 2016; 138:175-234.
- Sudarsana, E., Setiani, O., and Suhartono. (2013):Hubungan Riwayat Paparan Kromium dengan Gangguan Fungsi Ginjal pada Pekerja Pelapisan Logam di Kabupaten Tegal.Jurnal Kesehatan Lingkungan Indonesia 2013; 12:1.
- Kakkar P, Farhat NJ. Biological markers for metal toxicity. Environ Toxicol Pharmacol 2005; 19:335-349.
[Crossref] [Google scholar] [Pubmed]
- Schulte PA. Opportunities for the development and use of biomarkers. Toxicol let 1995; 77:25-29.
[Crossref] [Google scholar] [Pubmed]
- Antelmi A, Lovreglio P, Drago I, Greco L, Meliddo G, Manghisi MS, et al. Significance and Limitation of Creatinine Adjustment for Urinary Chromium and Arsenic in Biological Monitoring of Occupational Exposure to These Metallic Elements. G Ital Med Lav Ergon 2007; 29:288-291.
[Google scholar] [Pubmed]
- Angerer J, Amin W, Heinrich-Ramm R, Szadkowski D, Le- hnert G. Occupational chronic exposure to metals. I. Chromium exposure to stainless steel welders: biological monitoring. Int Arch Occup Environ Health 1987; 59:503-512.
[Crossref] [Google scholar] [Pubmed]
- Medeiros MG, Rodrigues AS, Batoreu MC. Elevated level of DNA-Protein crosslink and micronuclei in peripheral lymphocytes of tannery workers exposed to trivalent chromium. Mutagenesis 2003; 18:19–24.
[Crossref] [Google scholar] [Pubmed]
- Milja M, MarkkuL. Deramal Exposure to Chromium in the Grinding of Stainless and Acid-proof Steel. Ann occup Hyg 2004; 48:197–202.
[Crossref] [Google scholar] [Pubmed]
- Scheepers PTJ, Heussen GAH, Peer PGM, Verbist K, Anzion R, Willems J. Characterization of exposure to total and hexavalent chromium of welders using biological monitoring. Toxicol let 2008; 178:185-190.
[Crossref] [Google scholar] [Pubmed]
- Kortenkamp A. Problems in the biological monitoring of chromium (VI) exposed individuals. Biomarkers 1997; 2:73-79.
[Crossref] [Google scholar] [Pubmed]
- Bonde JP, Christensen JM. Chromium in biological samples from low-level exposed stainless steel and mild steel welders. Arch Environ Occup Health 1991; 46:225-229.
[Crossref] [Google scholar] [Pubmed]
- Lindberg E, Vesterberg O. Monitoring exposure to chromic acid in chrome plating by measuring chromium in urine. Scand J Work Environ Health 1983; 9:333-340.
[Crossref] [Google scholar] [Pubmed]
Copyright: © 2022 The Authors. This is an open access article under the terms of the Creative Commons Attribution NonCommercial ShareAlike 4.0 (https://creativecommons.org/licenses/by-nc-sa/4.0/). This is an open access article distributed under the terms of the Creative Commons Attribution License, which permits unrestricted use, distribution, and reproduction in any medium, provided the original work is properly cited.


